


Though many aspects of my golf game frustrate me to no end, I did discover early on an ability to hit the driver a pretty long way. This realization formed a tightly held belief that my distance with that club would be an advantage on par 5s (the longest holes on the course). Using that advantage as much as possible would clearly be the best way to reach my full potential as a golfer, so I decided I would pull out the “big dog,” as my son Andrew calls it, on the tee of every par 5.
Further strengthening my commitment to this approach was the ever-present, if unlikely, chance at an eagle putt – most commonly achieved by reaching the putting green of a par 5 in two shots. The inconvenient fact that I have only carded a handful of eagles in my life never seemed to be relevant information.
As time went on, it was surprising to look back and realize how poorly I was actually performing on par 5s. Following a particularly frustrating summer of golf a few years ago, I swore off using my driver on par 5s. For three straight rounds I switched to a 5-iron off the tee. My scores dramatically improved.
This created a very uncomfortable conflict for me. My established belief of where I owned an edge over most players was now squarely at odds with the empirical facts of my scores. I was experiencing cognitive dissonance.
The Theory of Cognitive Dissonance
Leon Festinger offered his theory of cognitive dissonance in 1957. He proposed that individuals have a powerful motivation to maintain cognitive consistency – that is to ensure beliefs and facts/experiences are in agreement. When these don’t align, the uncomfortable experience of cognitive dissonance occurs. The motivation to reconcile this discomfort leads one to actively avoid or reduce the inconsistency, many times by ignoring or rationalizing facts and experiences that cause the internal conflict.
Like staring at my scorecards and realizing the driver wasn’t providing the advantage I expected, there is empirical data with respect to investing and performance that is likely to make many of us uncomfortable. It cuts against the prevailing behavior of investors and it could bring you face-to-face with your own episode of cognitive dissonance.
Chasing manager performance does not work.
In fact, not only does it not improve results, there is evidence to suggest that approach actually degrades performance. It isn’t even a coin toss. And yet, the practice of selling “under-performing” strategies and replacing them with strategies that have “outperformed” persists. (Side note: There are several behavioral reasons for this tendency, such as recency bias, which are beyond the scope of this writing. This isn’t an attempt to explain why this pattern occurs; just that it lacks merit when viewed objectively.)
Figure 1:
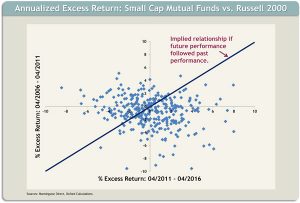
Figure 1 illustrates annual excess returns – in this case for 327 domestic small cap mutual funds relative to the Russell 2000 index – for two consecutive but distinct 5-year periods. Each dot is one of these 327 funds. The x-axis plots the excess return for the 5-year period ending 4/2011. The y-axis plots the excess return for the 5-year period ending 4/2016. Anything above 0 indicates the fund outperformed the index over that period and vice versa. If a fund outperformed the index over both periods, its dot would reside in the north-east quadrant. Similarly a fund with negative excess return over both periods would plot in the south-west quadrant.
The blue line represents the implied performance chasing belief system – a world where both under-performance and out-performance persist in future periods in perfect linear harmony. For the efficacy of that belief to be confirmed by the data, you would expect to see a clustering of dots around this line. It is obvious at first glance there is no discernible pattern between the two periods of time. (Note for math geeks: the best fit line is actually negative, though the r-squared factor is only 0.02.) There is no statistical relationship between past and future 5-year excess returns in this sample.
Feeling the dissonance yet?
Because we observe capital generally flowing into funds that have performed well recently and away from funds that have not, measuring the difference between dollar-weighted (investor) returns and time-weighted returns is a great way to determine how investors have fared in timing their investments using what appears to be a performance chasing approach. Investor returns include the effects of asset flows into and out of a fund. Time-weighted returns represent the pure return of the fund, offsetting the effects of capital flows.
In other words, what is the impact on returns when investors behave as if the blue line in Figure 1 is reality?
Figure 2:
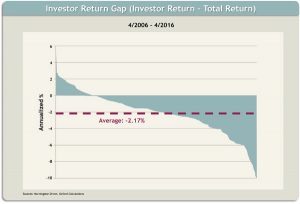
Using the same universe of small cap mutual funds, Figure 2 represents the scorecard for investors in those funds over the last 10 years. The “investor return gap” is simply the annual investor return minus the total return of the fund. When positive, investor returns exceeded the “pure” total return of the fund. When negative, the investor experience under-performed the total return.
This column chart plotting the investor return gap for each of the funds indicates an average gap of -2.17% annually over the 10-year period. The median gap is -1.91%, confirming the average is minimally influenced by outliers. While acknowledging several factors can impact this gap (for instance, this does not account for capital that leaves this group of mutual funds), the results clearly show poor timing decisions on balance. Nearly 15% of this sample group of funds has an investor return gap of -5% or worse annually over 10 years!
Perhaps ironically, an attempt to invest with managers that outperform their benchmarks is leading to a behavior that can inflict more damage on investor returns than failing to succeed in that endeavor. Over this period, the average fund in this sample experienced a total return of 5.11%. The iShares Russell 2000 Index ETF returned 5.42%. Investors in the funds captured an average 2.94% return.
It is worth mentioning there are valid reasons to invest in a fund that has experienced strong recent gains. There are also legitimate reasons to move on from a fund that has under-performed. Just realize the opposite is also true. Look back at Figure 1 and notice how many funds shifted from strong to weak relative performance and vice versa.
Conclusion
The bottom line is this: recent performance should be de-emphasized, and maybe even ignored, in the manager selection decision-making process. Instead, a long-term perspective, alignment of interests, full-cycle and rolling performance evaluations and starting valuations are more relevant in determining a thoughtful forward-looking investment allocation.
If you see me at the course this summer, there is a strong probability you’ll see a driver in my hand on par 5s. Some beliefs die hard, and besides, I might reach the green for an eagle putt! Shedding light on cognitive dissonance is one thing; dealing with it and changing behavior is an entirely different matter. In this case, simply avoiding the use of 1, 3 or even 5-year trailing performance as primary influences on manager decisions is a good start in closing the persistent investor return gap.
Jared Nishida, CFA is a Senior Investment Strategist & Oxford Investment Fellow at Oxford Financial Group. The above commentary represent the opinions of the authors as of 5.31.16 and are subject to change at any time due to market or economic conditions or other factors.