TwitterFacebookLinkedInEmailRSS
logo

An editorial blog of CFA Society Minnesota

  • Home
  • About Us
  • Contact Us
    • Compensation Survey Contact Form
  • Subscribe to Blog via Email

Author Archives: John Boylan, CFA

Easy as (Lotus) 123

6th October, 2014 · John Boylan, CFA · Leave a comment
John Boylan, CFA

Not long ago I wrote about how many securities analysts including myself have a strong, almost obsessive, preference towards calculator brands. Every so often I also get asked which software I prefer to analyze securities as well. Over time my answer has changed—to a simple spreadsheet.

Before you write me off as some technology Luddite (which my children did long ago), I believe there is a great deal of value within analytical software. I personally use these tools constantly. It saves a lot of time screening securities, determining potential valuations, and figuring out statistical nuances between competing investments. Most importantly is helps investment teams speak the same valuation language—at least in the initial investment discussion.

In other words, we all have “go to” tools in our valuation toolbox, which may differ dramatically from our co-workers favorite methodologies. Therefore having analytical software can help teams start with a base scenario for a particular security in which everyone can understand and discuss. However, it is the main tool I use to determine valuation and investment value? At least for me—no.

So why do I prefer the simple spreadsheet? It goes toward the qualitative side of investing—what I consider its art. So what is art (if you ever lived in Madison, WI in the 1980’s, you know Art was a window washer)? For me personally, the art of investing means determining the right questions to ask. Spending the half day to a day or so it takes me to generate models of the various financial statements of a company helps me think deeply about what happened in the company’s past as I enter those numbers into the spreadsheet. Can I see those same numbers much more quickly with analytical software? Yes, but in a strange way I find myself glossing over them more if they are merely provided to me as opposed to trying to build a model and trying to understand why a certain number or ratio is what it is. I have more intellectual ownership of the analysis if I build a model from scratch. Additionally it is a lot easier to make notes on your model changes in the spreadsheet than in analytical software. I wish I knew how many times I created a scenario in a software program and came back to it several weeks later wondering why I used the numbers that I did.

Again, I do find those products very useful and I use them quite a bit. However, if I want to really dig down deep into a company, I find the good old fashioned spreadsheet works best for me. Plus I may not not as a big of a technology Luddite as I think, as I once knew a person who did their models using just a calculator and MSWord.


Share this:

  • Click to share on Twitter (Opens in new window)
  • Click to share on Facebook (Opens in new window)
  • Click to email this to a friend (Opens in new window)
  • Click to share on LinkedIn (Opens in new window)
Posted in Freezing Assets Shout Out, Local Charterholders | Tags: freezing assets shout out, Lotus, number crunching, technology, valuation |

All Quiet on the Western Front

21st August, 2014 · John Boylan, CFA · Leave a comment
John Boylan, CFA

The 100th anniversary of the start of World War One (WWI) was a couple of weeks ago. Therefore I am reading the classic book, “The Guns of August” about the first dramatic weeks of the war from July-September 1914. Strangely enough, I did see some parallels in investing with some of the decisions made in those fateful weeks.

Years before the war even started both the Germans and the French had crafted meticulous war plans. The Germans had the Von Schlieffen plan and the French had “Plan 17” (which sounds like the title of a famously bad 1950s horror movie) which was crafted in part by Gen. Joffre. The Von Schlieffen plan required the Germans to bypass French fortifications near the French/German border by invading neutral Belgium and eventually northern France. The French, anticipating this in Plan 17, decided to attack the Germans in the middle of their lines near the Belgian Ardennes into central Germany thereby protecting France by putting Germany on the defensive on their home turf.

Early on in WWI both Germany and France rigidly stuck to their plans, which was one key reason WWI flamed out of control so quickly—those plan timetables must be met and, according to the military, should not be altered. Then as the war progressed both sides due to either favorable short term opportunities on the battlefield at the time, or out of panic by certain commanders, led to changes in the plan that were unthinkable just weeks before. This may have ultimately lengthened the war that led to disaster for both sides.

This, in an odd way, reminded me of investing. We all have investment plans and processes that we adhere. I am not talking about agreements about investment styles and parameters we have with clients/investors, which are sacrosanct. I am discussing about the way we invest, the way we think, and the way we profess to execute our plans to meet those investment goals.

Occasionally throughout the course of the investment cycle, situations arise that can cause us to consider temporarily deviating from our preferred and often proven investment strategies. One such example is what we commonly call a “trade” which is, or at least should be, a short-term bipolar event that has defined exit strategies—it works or it doesn’t and regardless it’s a short term position. Continuing the trade example, one mistake I made a while back was when a trade went against me and I did not exit. Instead, I added to the position thinking that if I liked the stock at the price I purchased it I should like it even more now at the lower price, essentially making it an investment instead of what it was: a trade. Using the WWI precedent mentioned above, I let a short-term tactic slightly change my personal long-term investment process—at least for the duration of that holding. This ended up making my longer-term objectives harder to make.

Ever since then I have tried to avoid shorter term tactics unless I have communicated to myself and those around me clearly what the short term objective is. That way I try to give myself accountability in exiting my trade timely instead of trying to justify how a trade that went bad is now an even better long-term holding. I think both Von Schlieffen and Joffre would agree.

Share this:

  • Click to share on Twitter (Opens in new window)
  • Click to share on Facebook (Opens in new window)
  • Click to email this to a friend (Opens in new window)
  • Click to share on LinkedIn (Opens in new window)
Posted in Freezing Assets Shout Out | Tags: freezing assets shout out, shout out, WWI |

Numbers Geek

13th August, 2014 · John Boylan, CFA · Leave a comment
John Boylan, CFA

What most lay people don’t know about people in our industry is what complete number geeks we really are. Geeky to the point where we have passionate feelings about our preferred calculator brand. For instance, we named our graduate school intramural football team “The HP 12Cs”, after our financial calculator of choice. Yes, we are numbers driven people and are passionate on how they are used in the investment process depending on where we are in the investment cycle.

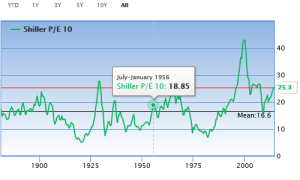
One thing I am noticing talking with fellow investors is how the numbers, as measured in earnings-based valuations, are leading them to fewer potential buy candidates as the market continues to grind higher. There have been non-stop debates if the market is under/overvalued since the beginning of this rally. As usual, it depends upon the numbers you look at for your reference point. The Schiller P/E chart, for instance appears to show that the market is near the top end of its historical range.


Chart: Historic Shiller P/E Ratios

(click on image to enlarge graph)

Chart Historic Shiller PE Ratios_FABlog

Source: gurufocus.com

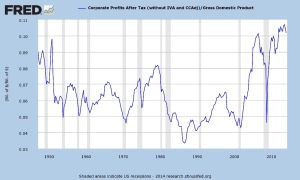
Additionally, looking at corporate profits as a percent of GDP can lead investors to wonder where the next leg of earnings growth may be.


Chart: Corporate Profits After Tax/Gross Domestic Product

(click on image to enlarge graph)

Chart Corporate Profits After TaxGross Domestic Product_FA Blog

Source: Federal Reserve Bank of St. Louis  


Sometimes, seemingly at least in part, at the expense of average household incomes.


Chart: Real Median Household Income in the United States

(click on image to enlarge graph)

Chart Real Median Household Income in the United States_FABlog

Source: Federal Reserve Bank of St. Louis  


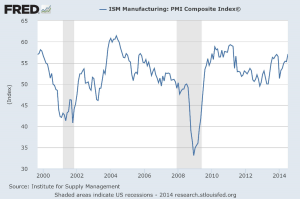
Still others offer compelling evidence (along with several charts, see link) that the market can continue to rally. Recent positive GDP data along with good ISM data (57.1, arguably a healthy reading and up from last month) and a progressing jobs picture may support further market gains.


Chart: ISM Manufacturing: PMI Composite Index

(click on image to enlarge graph)

Chart ISM Manufacturing PMI Composite Index_FABlog

Source: Federal Reserve Bank of St. Louis  


Personal feelings on how the market will perform in the near/mid-term aside (I think we will do OK as long as the market has confidence in the Fed and its tactics and/or if it will come to the rescue every time the market has a hot lava burp), the question I normally ask myself when there is a lot of high valuation discussions is not what will the market do next, but what is the best valuation methodology to use with a given security at this stage of the cycle. Especially since so many of us need to be fully invested regardless of market conditions.

Why? Because usually when there is much debate about stock valuations being too high we investors sometimes can get caught up in earnings stories that will likely evolve beyond our investment horizon (if at all) to justify the current heightened valuation. This in my experience usually led me to two separate risks: getting led into a value trap hoping that a poorly run laggard would catch up to its peers over time or relying on earnings estimates two or even three fiscal years out.

Usually in these circumstances I tend to gravitate toward revenue based methodologies, such as price/sales and top line growth rates. I always thought that 50%+ of valuation work starts with revenues to begin with as so many estimates on all financial statements are driven by this line item. Additionally if the market continues to gravitate towards growth stocks I avoid value traps by only focusing on companies that can deliver on top line growth instead of focusing on margins and earnings that may never come. Conversely if the market begins to slip, if I focus on companies with a lower price to sales ratio, I don’t have to worry as much about discretionary actions a management team might do in a downturn such as delay or cut a stock buyback program, or what cuts they may make to “make the earnings number” in the short term but could harm future growth.

Share this:

  • Click to share on Twitter (Opens in new window)
  • Click to share on Facebook (Opens in new window)
  • Click to email this to a friend (Opens in new window)
  • Click to share on LinkedIn (Opens in new window)
Posted in Freezing Assets Shout Out, Hot Topic Commentary, Local Charterholders | Tags: freezing assets shout out, household income, Numbers Geek, P/E Ratios |

Back to the Basics

30th July, 2014 · John Boylan, CFA · Leave a comment
John Boylan, CFA

Lately you can’t open up any financial publication or website without seeing some investor prognosticate about what companies or industries are most ripe for this business strategy or that. Right now tax inversions are the craze. Just before the financial crisis it was private equity buy-outs. And divining potential stock buybacks never, ever goes out of style.

We wrote a little bit about inversions in the past. Is it a good business strategy? Perhaps. Lots can be said for lowering a tax bill and plowing cash back into new growth strategies such as new equipment, etc. or just plain giving the cash back to investors.

But is identifying potential investment candidates that might benefit from a change in business strategies like an inversion a bankable investment strategy? Not if that is your only goal in my view. However, in a strange way, I think looking at companies in that light is a healthy thing for the investment industry as a whole because it does get investors to get back to the basics.

How? The cynic in me sometimes thinks that we investors strive to make the due diligence process as complex and opaque as possible sometimes to justify our existence. Instead, I have always thought that the due diligence process was actually quite elegant—the vast majority of time we compare and contrast business models and structures. Period. And in reality, the differences in successful business models and structures are usually observable and repeatable across business sectors.

Often in my observation successful investments are based on answering a number of basic questions. These questions include but are not limited to: Does the model work over time? Is it differentiated? Is it defensible? Is it diversified? Do they have a solid business structure as measured by cash flows and healthy balance sheets to not only maintain but grow the model? Can a company change its capital structure to optimize those cash flows?

Ironically when I look at companies and think about if they are ripe for a tax inversion, I often start with those questions. Then I realize what I am really looking for is a well-run company that has a defensible business model that is difficult to replicate anywhere in the world, has the smarts to be fully knowledgeable of their business options, and has financial flexibility to endeavor those strategies. In other words, what I am looking for is a good, solid company that has a lot of solid options for its business. Tax inversion or not, that’s what we all strive to find as investors.

Share this:

  • Click to share on Twitter (Opens in new window)
  • Click to share on Facebook (Opens in new window)
  • Click to email this to a friend (Opens in new window)
  • Click to share on LinkedIn (Opens in new window)
Posted in Freezing Assets Shout Out | Tags: back to the basics, freezing assets shout out, shout out, tax inversion |

Inversion Layer

19th June, 2014 · John Boylan, CFA · Leave a comment
John Boylan, CFA

The recent popularity of tax inversion strategies got me to thinking about what might be the toughest thing to do when analyzing a company. Namely determining what its optimal capital and tax structure could be. Most of the time, I tend to rely more on free cash flow analysis than trying to forecast capital structure or determine optimal tax considerations. I figure if I develop a reasonable and attainable cash flow forecast it would be easier to determine what the use of that cash might be. Even then I tended to be off in my cash use prediction because of the Curse of the Financial Analyst—we think tend to think every business decision is a financial decision. More often than not many other business and management considerations are of equal, if not higher, importance. We as analysts often forget that.

For example, why don’t more companies take advantage of tax inversion strategies? Management might feel uncomfortable having essentially two headquarters, one for executive management and one for day to day operations—some managements may feel uncomfortable managing crucial functions remotely. Some might feel that tax advantages and loopholes can shift over time for a variety of reasons, meaning a company may have to move its headquarters more than once to keep their tax saving strategy intact (e.g. Accenture moved to Ireland from Bermuda due to changes in tax considerations). Additionally some companies might see longer term opportunities for that cash that could offer a better return, even after taxes. This might include investments in research and development, marketing and distribution, new capacity, acquisitions, and the like. It also depends on where the cash resides and the opportunities, or lack thereof, there might be in that market.

Still as shareholders we often want as much cash returned to us from our investments as quickly as possible, and managements need to respect the will of its owners when it makes sense to do so over the long run. It really comes down in my view where the management and investors believe the company is in its growth cycle. If it is early on in the cycle I would rather see cash spent on growth, which also lowers a company’s tax bill without adding more managerial complexity to the organization. If the company is in a more mature industry I would rather see the company managed for cash flow and see that money returned to investors. Therefore in reality, I think that we need to take as close of a look at the personality and management style of its executive team and determine if their longer term goals match where we think the company is in its growth cycle as much as we do trying to determine what companies may be best suited for a change in capital or tax structure on a pure numbers basis.

Share this:

  • Click to share on Twitter (Opens in new window)
  • Click to share on Facebook (Opens in new window)
  • Click to email this to a friend (Opens in new window)
  • Click to share on LinkedIn (Opens in new window)
Posted in Freezing Assets Shout Out, Hot Topic Commentary, Local Charterholders | Tags: freezing assets shout out, inversion layer |
Previous Posts
Next Posts

Subscribe to Blog via Email

Enter your email address to subscribe to this blog and receive notifications of new posts by email.

Recent Posts

  • Important Minnesota Financial Literacy Legislation Update 03/20/2023
  • New Financial Literacy Effort Launched for Minnesota Communities and Schools 09/30/2022
  • End of an Era 07/26/2022
  • Starting my Midwestern Goodbye 04/05/2022
  • Face-Off 10/18/2021

Submit your inquiry here

Categories

  • Compliance (3)
  • Department of Labor Fiduciary Rule (1)
  • Ethics (7)
    • Ask the Ethicist (2)
  • Freezing Assets Shout Out (34)
  • Hot Topic Commentary (177)
  • Intellisight (1)
  • Local Charterholders (88)
  • Member Spotlight (4)
  • Society President Letters (15)
  • Spotlight on MN Companies (1)
  • Valuation (2)
  • Weekly Credit Wrap (35)

Archives

  • March 2023 (1)
  • September 2022 (1)
  • July 2022 (1)
  • April 2022 (1)
  • October 2021 (1)
  • August 2021 (1)
  • May 2021 (1)
  • February 2021 (1)
  • January 2021 (2)
  • October 2020 (2)
  • September 2020 (2)
  • August 2020 (1)
  • June 2020 (1)
  • February 2020 (1)
  • December 2019 (1)
  • November 2019 (2)
  • October 2019 (1)
  • September 2019 (1)
  • August 2019 (1)
  • July 2019 (2)
  • June 2019 (1)
  • April 2019 (3)
  • March 2019 (2)
  • February 2019 (1)
  • January 2019 (2)
  • December 2018 (1)
  • November 2018 (2)
  • October 2018 (3)
  • September 2018 (1)
  • April 2018 (3)
  • March 2018 (8)
  • February 2018 (3)
  • January 2018 (1)
  • November 2017 (5)
  • September 2017 (1)
  • August 2017 (3)
  • July 2017 (1)
  • June 2017 (1)
  • May 2017 (1)
  • April 2017 (2)
  • March 2017 (1)
  • December 2016 (2)
  • November 2016 (2)
  • October 2016 (1)
  • September 2016 (1)
  • August 2016 (1)
  • July 2016 (2)
  • June 2016 (5)
  • May 2016 (2)
  • April 2016 (2)
  • February 2016 (5)
  • January 2016 (3)
  • December 2015 (1)
  • November 2015 (4)
  • October 2015 (6)
  • September 2015 (1)
  • July 2015 (1)
  • June 2015 (6)
  • April 2015 (2)
  • March 2015 (4)
  • February 2015 (2)
  • December 2014 (2)
  • November 2014 (7)
  • October 2014 (10)
  • September 2014 (3)
  • August 2014 (5)
  • July 2014 (2)
  • June 2014 (5)
  • May 2014 (9)
  • April 2014 (9)
  • March 2014 (8)
  • February 2014 (7)
  • January 2014 (8)
  • December 2013 (6)
  • November 2013 (7)
  • October 2013 (13)
  • September 2013 (4)
  • August 2013 (2)

Popular Tags

#memberspotlight 2015 Compensation Survey A Day in the Life BlackRock Board of Directors Carlson School of Management CFA CFA Charter CFA Charterholder CFA Charterholders CFA Institute CFA Institute Research Challenge CFA Minnesota CFAMN CFA Program CFA Society Minnesota CFA Society MN Changing Perceptions Chartered Financial Analyst charterholders Compensation Survey Diversity ESG ethics freezing assets shout out interest rates investment management Josh Howard Joshua M. Howard Member Engagement Minnesota non-GAAP earnings North Dakota Nuveen Asset Management President's Letter SEC Society President South Dakota Susanna Gibbons University of Minnesota Volunteer Volunteering Volunteers Weekly Credit Wrap women in finance
© 2021 CFAMN Freezing Assets - Please note that the content of this site should not be construed as investment advice, nor do the opinions expressed necessarily reflect the views of CFAMN, FreezingAssets.org or CFA Institute.
  • Home
  • Log In
  • RSS Feed